
Page 118 - Demo
P. 118
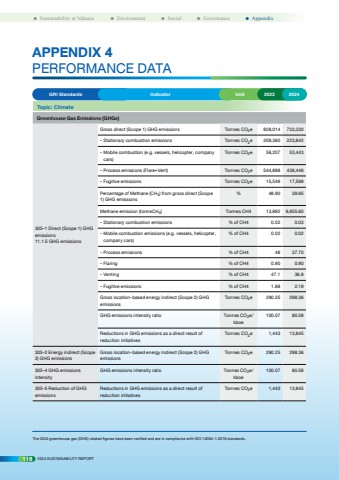
GRI Standards Indicator Unit 2023 2024 Topic: Climate Greenhouse Gas Emissions (GHGs)305-1 Direct (Scope 1) GHG emissions11.1.5 GHG emissionsGross direct (Scope 1) GHG emissions Tonnes CO2e 828,014 733,330- Stationary combustion emissions Tonnes CO2e 209,360 223,842- Mobile combustion (e.g. vessels, helicopter, company cars)Tonnes CO2e 58,207 53,443- Process emissions (Flare+Vent) Tonnes CO2e 544,898 438,446- Fugitive emissions Tonnes CO2e 15,549 17,599Percentage of Methane (CH4) from gross direct (Scope 1) GHG emissions % 48.90 39.95Methane emission (tonneCH4) Tonnes CH4 13,892 9,855.60- Stationary combustion emissions % of CH4 0.02 0.03- Mobile combustion emissions (e.g. vessels, helicopter, company cars)% of CH4 0.02 0.02- Process emissions % of CH4 48 37.70- Flaring % of CH4 0.90 0.90- Venting % of CH4 47.1 36.8- Fugitive emissions % of CH4 1.88 2.19Gross location-based energy indirect (Scope 2) GHG emissionsTonnes CO2e 290.25 298.36GHG emissions intensity ratio Tonnes CO2e/kboe100.07 80.58Reductions in GHG emissions as a direct result of reduction initiativesTonnes CO2e 1,443 13,845 305-2 Energy indirect (Scope 2) GHG emissions Gross location-based energy indirect (Scope 2) GHG emissionsTonnes CO2e 290.25 298.36305-4 GHG emissions intensity GHG emissions intensity ratio Tonnes CO2e/kboe100.07 80.58305-5 Reduction of GHG emissions Reductions in GHG emissions as a direct result of reduction initiativesTonnes CO2e 1,443 13,845 APPENDIX 4PERFORMANCE DATAThe 2024 greenhouse gas (GHG) related figures have been verified and are in compliance with ISO 14064-1:2018 standards.118 2024 SUSTAINABILITY REPORT%uf098 Sustainability at Valeura %uf098 Environment %uf098 Social %uf098 Governance %uf098 Appendix
